NOTE: Figure above updated 8 January to correct an error in 2017 values (I failed to correct 2017 for inflation).Correction reduces the value from 0.44% to 0.41%. 2017 stays in 2nd place. Apologies.
The figure above shows the annual costs of weather disasters (data from Munich Re) as a proportion of global GDP (data from the UN), from 1990 to 2017.
Takeaways:
- 2017 ranks 2nd to 2005;
- The dataset is dominated by US hurricanes (accounting for about 70% of losses);
- The trend from 1990 to 2017 is downward;
- Mean and median are both 0.24%;
- 6 of past 10 years have been below average;
The most important caveat: don’t use disasters to argue about trends in climate. Use climate data. Duh. (Pielke 2015 below has an accessible summary of IPCC conclusions on trends in weather extremes. See also IPCC SREX and AR5 .) Trends in the incidence of extreme weather help to explain this graph as the world has experienced a long stretch of good fortune (see Pielke 2017, linked below).
Comments, questions welcomed.
Further reading:
Mohleji, S., & Pielke Jr, R. 2014. Reconciliation of trends in global and regional economic losses from weather events: 1980–2008. Natural Hazards Review, 15(4).
Murray, V., & Ebi, K. L. 2012. IPCC special report on managing the risks of extreme events and disasters to advance climate change adaptation (SREX).
Pielke, Jr., R. 2017. Weather-related Natural Disasters: Should we be concerned about a reversion to the mean? Risk Frontiers
Pielke, Jr. R. 2015. The rightful place of science: disasters and climate change. (CSPO/ASU).
Stocker, T. F., et al. 2013. IPCC 2013: climate change 2013: the physical science basis. Contribution of working group I to the fifth assessment report of the intergovernmental panel on climate change.
UPDATE 8 January 2018 – Data for the chart above
| YEAR |
Weather-related losses in 2013 $ |
Global GDP in 2013 $ |
losses/GDP |
| 1990 |
80.7 |
34558.3 |
0.23% |
| 1991 |
94.0 |
34916.9 |
0.27% |
| 1992 |
112.0 |
35538.7 |
0.32% |
| 1993 |
132.8 |
36056.9 |
0.37% |
| 1994 |
82.2 |
37179.5 |
0.22% |
| 1995 |
100.3 |
38283.0 |
0.26% |
| 1996 |
113.6 |
39539.4 |
0.29% |
| 1997 |
63.5 |
41015.9 |
0.15% |
| 1998 |
170.4 |
42111.2 |
0.40% |
| 1999 |
123.0 |
43448.9 |
0.28% |
| 2000 |
63.5 |
45238.7 |
0.14% |
| 2001 |
41.5 |
46076.7 |
0.09% |
| 2002 |
111.6 |
47042.0 |
0.24% |
| 2003 |
88.5 |
48243.0 |
0.18% |
| 2004 |
144.1 |
50159.9 |
0.29% |
| 2005 |
266.3 |
51943.4 |
0.51% |
| 2006 |
69.7 |
54113.6 |
0.13% |
| 2007 |
96.3 |
56259.6 |
0.17% |
| 2008 |
141.8 |
57067.2 |
0.25% |
| 2009 |
70.9 |
55707.6 |
0.13% |
| 2010 |
123.0 |
57952.2 |
0.21% |
| 2011 |
170.8 |
59595.5 |
0.29% |
| 2012 |
153.9 |
61647.7 |
0.25% |
| 2013 |
125.3 |
63805.4 |
0.20% |
| 2014 |
94.5 |
66038.6 |
0.14% |
| 2015 |
77.3 |
68350.0 |
0.11% |
| 2016 |
128.2 |
70742.2 |
0.18% |
| 2017 |
298.6 |
73218.2 |
0.41% |

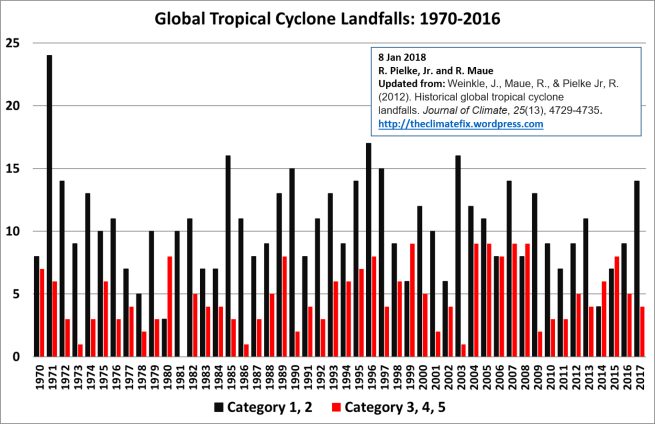
 In 2012, Jessica Weinkle, Ryan Maue and I published a paper that compiled data on landfalls of hurricane-strength tropical cyclones around the world. While many individual basins have data further back in time, a reliable global dataset is available from 1970.